Business Intelligence
Overview
I am a SQL Server DBA and Business Intelligence professional who loves transforming messy, scattered data into clear, decision-ready stories. This portfolio presents selected work in Tableau, Power BI, SQL, Python and Google Sheets, highlighting my end-to-end skills: data modeling, ETL, cloud migration, performance tuning, DAX and visual design, applied to real scenarios in healthcare, HR and operations, always focused on clear, stakeholder-friendly insights that drive smarter business decisions.
Python – Data Analysis
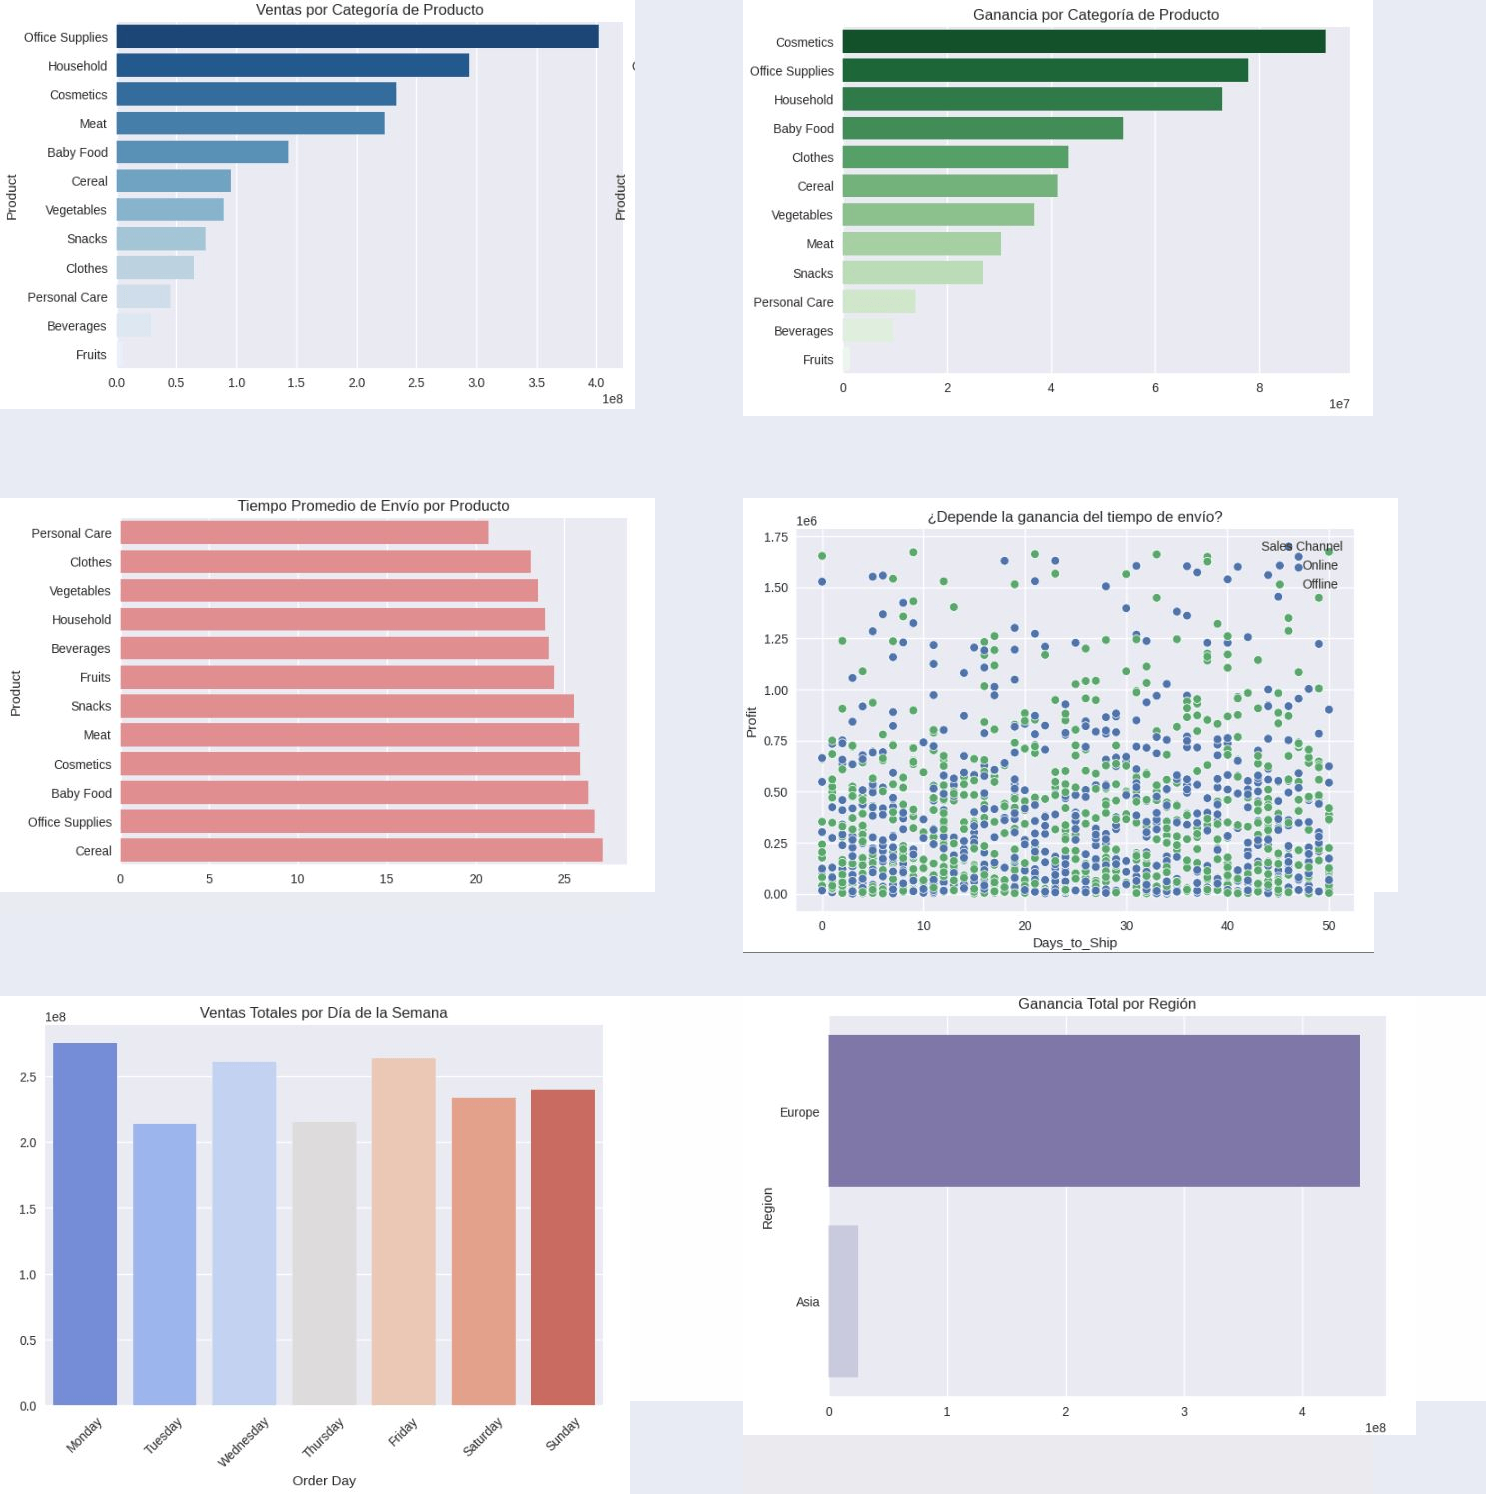
This Python project performs an end-to-end exploratory data analysis on global sales data. Multiple datasets (events, products and countries) are cleaned, merged and enriched to calculate key business metrics such as revenue, profit and shipping time. The analysis explores product performance, regional profitability, sales channels and temporal trends using pandas, matplotlib and seaborn.

Project Duration: 1 week
Tableau

This Tableau dashboard analyzes Netflix’s global catalog by type, release year, geography and content trends. It highlights the dominance of movies versus TV shows, visualizes release patterns over time, and maps country distribution. Dynamic metrics show how the catalog evolves across years, while genre-based timelines reveal shifts in dramas and comedies. The final result is an interactive, multi-layered view that helps users explore how Netflix’s library grows and changes.
Project Duration: 1 week
Power BI

This Power BI dashboard delivers a comprehensive view of HR performance across the organization. It highlights key metrics such as employee engagement, satisfaction, work-life balance trends, and monthly terminations. Department-level comparisons reveal variations in culture and performance, while time-series visuals track workforce well-being across survey periods. With dynamic filters for status and performance scores, the report enables leaders to diagnose issues, monitor trends, and make data-driven HR decisions.
Project Duration: 1 week
MySQL & PostgreSQL

This project integrates data from two healthcare systems—PostgreSQL (HQ) and MySQL (Branch)—into a unified Power BI dashboard. It models patients, doctors, appointments, treatments, and billing workflows using realistic hospital datasets. The solution enables cross-system analytics, including patient volume, appointment trends, doctor productivity, and financial metrics. Visualizations combine both databases to deliver a consolidated and actionable view of clinic performance.
Project Duration: 1 week
Tools